I Found the Perfect Liquidity Setup (90% Accuracy)
Smart Risk
Overview
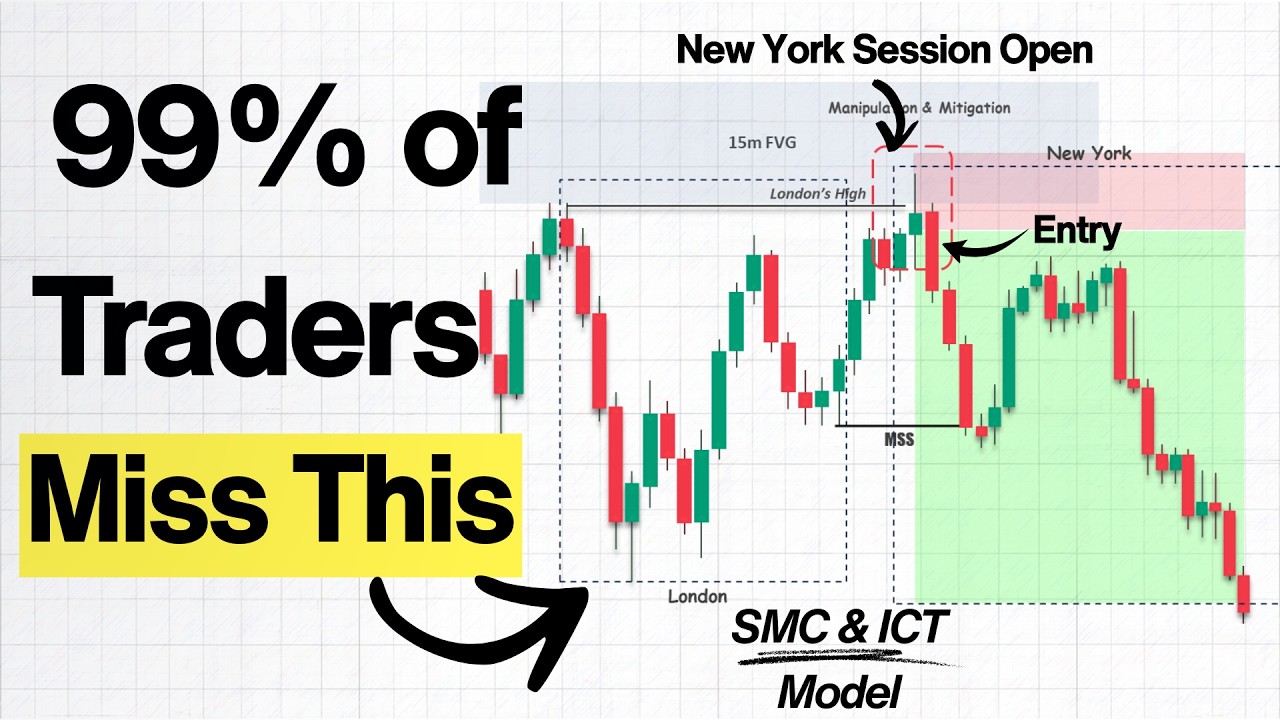
This video explains an advanced trading strategy that combines liquidity sweeps, fair value gaps (FVGs), and session timing to identify high-probability trading setups. The core concept involves price clearing external liquidity (like previous session highs or lows) and simultaneously mitigating an unmitigated FVG. This dual action cleans the path for significant price movement. The strategy is detailed with mechanical rules for both bearish and bullish scenarios, including entry models using lower timeframes (1-minute or 5-minute charts) with specific confirmation patterns like inversion FVGs or breaker/mitigation blocks. The video emphasizes the importance of proper alignment with market structure and session times for optimal results, providing practical chart examples for execution.
Save this permanently with flashcards, quizzes, and AI chat
Chapters
- The strategy integrates higher timeframe dynamic liquidity delivery, external liquidity sweeps, and session timing for high-probability setups.
- In a bullish scenario, price sweeps sell-side liquidity, taps a bullish FVG, reverses inside a key level, and moves higher.
- In a bearish scenario, price sweeps buy-side liquidity, taps a bearish FVG, reverses inside a key level, and moves lower.
- The setup's power comes from simultaneously clearing external liquidity and mitigating an FVG, removing stop losses and imbalances.
- Identify a previous session high below an unmitigated 15-minute bearish FVG (e.g., Asian session high below London session FVG).
- Wait for the target session (e.g., London open) to sweep the identified liquidity and tap into the FVG, then reverse back inside the range.
- Confirm on a lower timeframe (1-min or 5-min) using an entry model like an inversion FVG (1-min) or a breaker/mitigation block (5-min).
- An inversion FVG on the 1-min chart, formed after the liquidity sweep, acts as a resistance level for entry.
- A market structure shift on the lower timeframe adds further confluence to the setup.
- Entry Option 1: Enter at the open of the candle following the formation of the inversion FVG, with a stop loss above the recent swing high.
- Entry Option 2: Place a sell limit order at the lowest point of the inversion FVG, waiting for price to retrace and trigger the entry.
- Take profit targets can be the nearest sell-side liquidity, session midpoint, or a fixed risk-to-reward ratio (e.g., 2.5 or 3:1).
- Add-on entries can be taken on new bearish FVGs formed during pullbacks after a break of structure, if there's sufficient room to move lower.
- On a 5-minute chart, after the higher timeframe liquidity sweep and FVG mitigation, look for a breaker block or mitigation block.
- A bearish breaker block forms after a swing high, swing low, higher high, followed by bearish expansion breaking structure.
- The breaker block zone is the down-close candle(s) between the first swing high and swing low.
- A bearish mitigation block forms after a swing high, swing low, lower high, followed by bearish displacement breaking the swing low.
- The mitigation block zone is the last down-close candle(s) between the first swing high and swing low.
- Higher timeframe FVGs often form after strong moves in previous sessions.
- The setup remains valid as long as price is sweeping previous session highs/lows and interacting with the higher timeframe FVG.
- The setup loses reliability once the higher timeframe FVG is completely mitigated (filled).
- Consider additional confirmations like V-shaped recoveries or changes in the state of delivery.
- On EUR/USD 15-min, an unmitigated bearish FVG formed during the Asian session, with the New York session high below it.
- Price swept the New York high, tapped the 15-min FVG, and showed rejection, moving back inside the range.
- On the 1-min chart, an inversion FVG formed after the sweep and FVG mitigation, accompanied by a market structure shift.
- A sell position was entered at the next candle open after the inversion FVG, targeting the nearest sell-side liquidity for a 2.5 R:R.
- On EUR/USD 15-min, an unmitigated bullish FVG formed below the New York low.
- Price swept the New York low during the Asian session and immediately rejected, moving higher.
- On the 1-min chart, a bullish market structure shift occurred, and a breaker block formed.
- A buy limit order was placed at the highest point of the breaker block, targeting nearby buy-side liquidity for a 3.5 R:R.
- A continuation entry was taken on a subsequent bullish FVG during a pullback, targeting the London high.
Key takeaways
- High-probability trading setups arise when price simultaneously clears external liquidity and mitigates a fair value gap.
- Proper alignment of liquidity sweeps, fair value gaps, and specific market session timings is crucial for the strategy's effectiveness.
- Lower timeframe analysis (1-min or 5-min) is essential for identifying precise entry triggers after higher timeframe conditions are met.
- Confirmation patterns like inversion FVGs, breaker blocks, and mitigation blocks on lower timeframes provide mechanical entry signals.
- The validity of the setup diminishes once the higher timeframe fair value gap is fully mitigated.
- Defined entry and exit rules, including stop-loss placement and take-profit targets, are key to managing risk and maximizing reward.
- The strategy can be applied in both bearish and bullish market conditions by reversing the logic.
Key terms
Test your understanding
- What are the three main components that must align for this high-probability trading setup to form?
- Why is the simultaneous mitigation of a fair value gap and a liquidity sweep considered a powerful market event?
- How does a trader identify a valid bearish breaker block on a 5-minute chart after a liquidity sweep?
- What conditions must be met for a trading setup to lose its reliability, according to the video?
- Describe the process of entering a trade using an inversion fair value gap on the 1-minute chart.