31:01
Velocity Time Graphs, Acceleration & Position Time Graphs - Physics
The Organic Chemistry Tutor
Overview
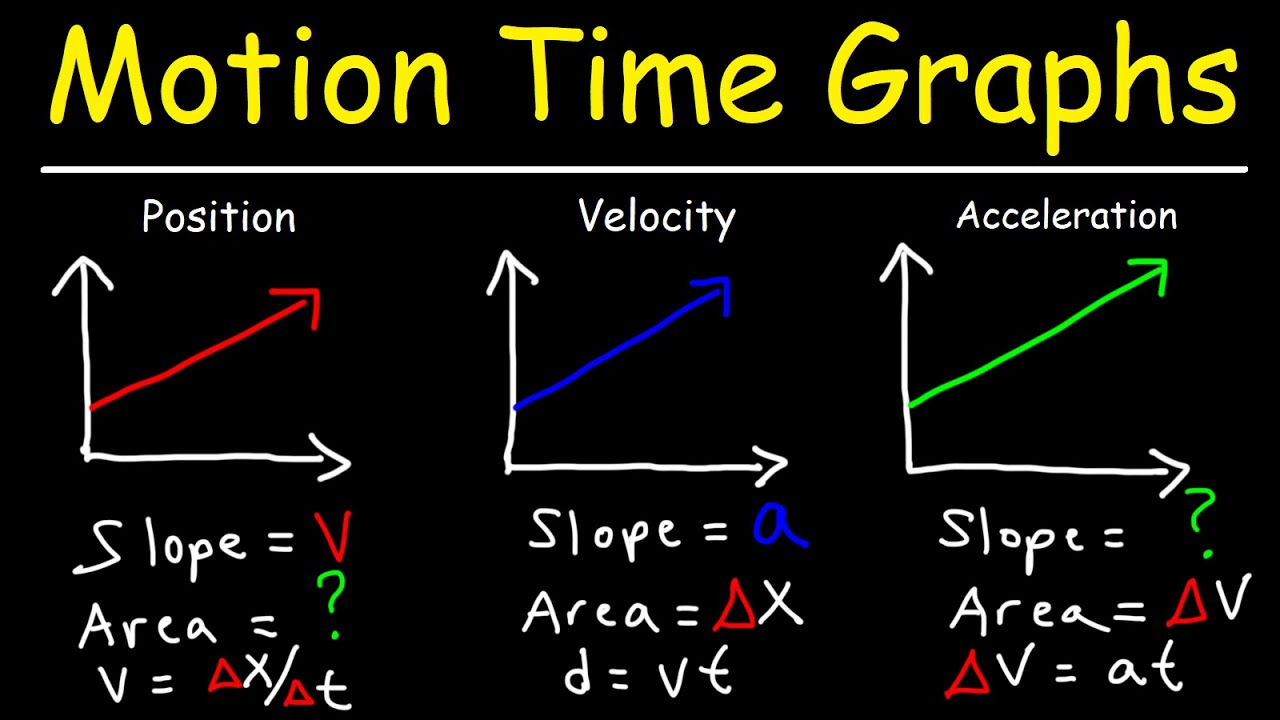
This video explains how to interpret motion graphs, specifically position-time, velocity-time, and acceleration-time graphs. It emphasizes the relationship between the slope and area of these graphs and the physical quantities they represent: velocity, acceleration, and displacement. The video also details how to determine if an object is speeding up or slowing down based on the signs of velocity and acceleration, and how to analyze different shapes of position-time graphs, including linear and parabolic curves, to infer motion characteristics.
How was this?
Save this permanently with flashcards, quizzes, and AI chat
Chapters
- The slope of a graph represents division (change in y / change in x).
- The area under a graph represents multiplication (y-value * x-value).
- These concepts are crucial for understanding what different parts of motion graphs signify.
Understanding the fundamental mathematical operations of slope and area provides the key to unlocking the physical meaning embedded within motion graphs.
Calculating the slope of a line segment by dividing the change in y-values by the change in x-values, and calculating the area of a rectangle by multiplying its length and width.
- The slope of a position-time graph represents velocity.
- A positive slope indicates positive velocity (moving in the positive direction).
- A negative slope indicates negative velocity (moving in the negative direction).
- A zero slope (horizontal line) indicates zero velocity (object is at rest).
- The area under a position-time graph does not yield a meaningful physical quantity.
Position-time graphs allow us to visualize an object's location over time and directly infer its speed and direction of motion.
A straight line sloping upwards on a position-time graph signifies constant positive velocity, meaning the object is moving away at a steady pace.
- The slope of a velocity-time graph represents acceleration (change in velocity / change in time).
- The area under a velocity-time graph represents displacement (velocity * time).
- These graphs are essential for understanding how an object's velocity changes and how far it travels.
Velocity-time graphs are powerful tools for analyzing how an object's motion changes over time, revealing both its acceleration and its net change in position.
The area of a rectangular section on a velocity-time graph, calculated by multiplying the velocity value by the time interval, directly gives the displacement during that interval.
- The slope of an acceleration-time graph represents 'jerk' (the rate of change of acceleration), which is rarely used in introductory physics.
- The area under an acceleration-time graph represents the change in velocity (acceleration * time).
- These graphs help us understand the nuances of how acceleration itself is changing.
Acceleration-time graphs provide insight into the rate at which velocity is changing, which is fundamental to understanding more complex motion.
The area under an acceleration-time graph, calculated by multiplying acceleration by time, gives the total change in velocity over that period.
- Velocity is a vector (magnitude and direction), while speed is a scalar (magnitude only).
- An object is speeding up when its velocity and acceleration have the same sign (both positive or both negative).
- An object is slowing down when its velocity and acceleration have opposite signs.
- Velocity is the rate of change of position; acceleration is the rate of change of velocity.
Clearly distinguishing between speed and velocity, and understanding the conditions for speeding up or slowing down, are critical for accurately describing and predicting an object's motion.
If velocity is positive and acceleration is positive, the object speeds up. If velocity is negative and acceleration is negative, the object also speeds up (becomes more negative).
- Linear position-time graphs (straight lines) indicate constant velocity and zero acceleration.
- Upward sloping lines mean positive velocity; downward sloping lines mean negative velocity.
- Parabolic (curved) position-time graphs indicate changing velocity and therefore non-zero acceleration.
- Concave down curves imply negative acceleration, while concave up curves imply positive acceleration.
The shape of a position-time graph directly translates into the object's acceleration and whether its velocity is increasing or decreasing.
A position-time graph that curves upwards (concave up) shows that the velocity is increasing, indicating positive acceleration.
Key takeaways
- The slope of a position-time graph represents velocity, while the slope of a velocity-time graph represents acceleration.
- The area under a velocity-time graph represents displacement, and the area under an acceleration-time graph represents the change in velocity.
- An object speeds up when its acceleration and velocity have the same sign, and slows down when they have opposite signs.
- The shape of a position-time graph (linear, curved, concave up/down) reveals information about the object's acceleration.
- Velocity is the rate of change of position, and acceleration is the rate of change of velocity.
- Distinguishing between position-time and distance-time graphs is important, as their slopes represent velocity and speed, respectively.
Key terms
Position-time graphVelocity-time graphAcceleration-time graphSlopeAreaVelocityAccelerationDisplacementSpeedJerk
Test your understanding
- What physical quantity does the slope of a velocity-time graph represent, and why?
- How can you determine if an object is speeding up or slowing down using a velocity-time graph?
- What does the area under an acceleration-time graph signify, and how is it calculated?
- Explain the difference between the slope of a position-time graph and the slope of a distance-time graph.
- How does the concavity (curved shape) of a position-time graph relate to the object's acceleration?