5:21
Normal Distribution: Calculating Probabilities/Areas (z-table)
Joshua Emmanuel
Overview
This video explains how to calculate probabilities for a normal distribution using z-scores and standard normal tables (z-tables). It covers transforming raw scores into z-scores, interpreting the z-table to find the area (probability) to the left of a z-score, and calculating probabilities for 'less than,' 'greater than,' and 'between' scenarios. The standard normal distribution, with a mean of 0 and a standard deviation of 1, is central to these calculations, allowing us to use a universal table for any normal distribution.
How was this?
Save this permanently with flashcards, quizzes, and AI chat
Chapters
- A normal distribution is a symmetric, bell-shaped curve where the total area under the curve represents 100% or a probability of 1.
- The standard normal distribution (z-distribution) is a specific normal distribution with a mean of 0 and a standard deviation of 1.
- A z-score measures how many standard deviations a particular data point (x) is away from the mean (µ) of its distribution.
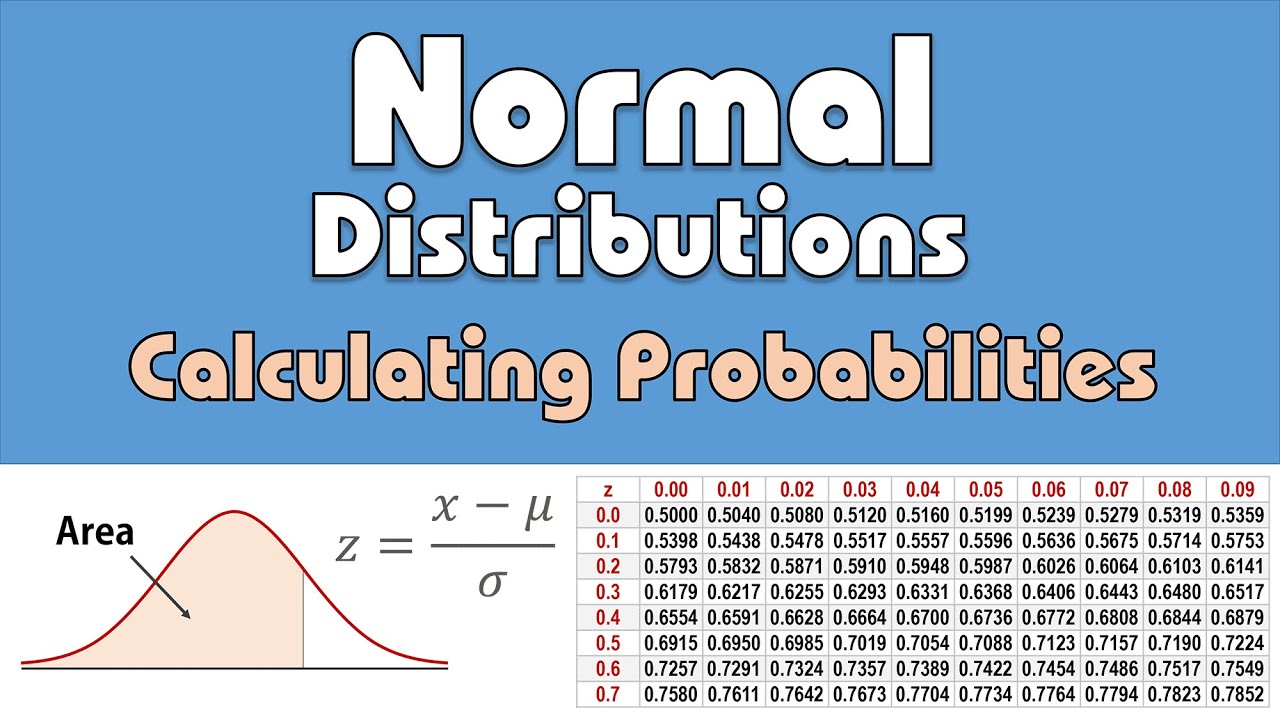
- The formula to convert any score (x) to a z-score is z = (x - µ) / σ.
Understanding z-scores allows us to standardize different normal distributions, making it possible to compare values and calculate probabilities using a single, universal table.
The formula z = (x - µ) / σ is used to transform an exam score (x) into a z-score, given the exam's mean (µ) and standard deviation (σ).
- Standard normal tables (z-tables) typically provide the cumulative area to the left of a given z-score.
- To find the probability that a score is less than a certain value (P(x < value)), first calculate the corresponding z-score.
- Locate the z-score on the table (using the row for the first two digits and the column for the third decimal digit) to find the area to its left.
- This area directly represents the probability P(z < calculated z-score).
This is the most direct application of the z-table, providing a straightforward method to find the probability of a value falling below a specific threshold.
For an exam score of 54 (mean=65, std dev=9), the z-score is -1.22. Looking up -1.22 in the z-table gives an area of 0.1112, meaning P(x < 54) = P(z < -1.22) = 0.1112 or 11.12%.
- The probability of a score being greater than a certain value (P(x > value)) is equivalent to P(z > calculated z-score).
- Since the total area under the curve is 1, the area to the right of a z-score is calculated as 1 minus the area to the left of that z-score.
- Find the area to the left of the z-score using the z-table, then subtract this value from 1 to get the 'greater than' probability.
This technique allows us to determine the likelihood of a value exceeding a certain benchmark, which is crucial for setting thresholds or understanding performance above a certain level.
For an exam score of at least 80 (mean=65, std dev=9), the z-score is 1.67. The z-table shows the area to the left of 1.67 is 0.9525. Therefore, P(x ≥ 80) = P(z > 1.67) = 1 - 0.9525 = 0.0475 or 4.75%.
- To find the probability that a score falls between two values (P(value1 < x < value2)), calculate the z-scores for both values.
- Use the z-table to find the cumulative area to the left for both z-scores.
- Subtract the smaller area (corresponding to the smaller z-score) from the larger area (corresponding to the larger z-score).
- The result is the probability that the score lies within the specified range.
This method is essential for understanding the probability of a data point falling within a specific range or interval, useful for quality control or defining performance bands.
For scores between 70 and 86 (mean=65, std dev=9), the z-scores are 0.56 and 2.33. The areas to the left are 0.7123 and 0.9901, respectively. The probability is 0.9901 - 0.7123 = 0.2778 or 27.78%.
Key takeaways
- The z-score standardizes any normal distribution, allowing the use of a single z-table to find probabilities.
- The z-table provides the area (probability) to the left of a given z-score.
- To find P(z > a), calculate 1 - P(z < a).
- To find P(a < z < b), calculate P(z < b) - P(z < a).
- Rounding z-scores to two decimal places is necessary for using standard z-tables.
- Probabilities calculated from the z-table represent the proportion or percentage of data falling within specific ranges of the normal distribution.
Key terms
Normal DistributionStandard Normal DistributionZ-distributionZ-scoreMean (µ)Standard Deviation (σ)Cumulative AreaZ-Table
Test your understanding
- What is the purpose of converting a raw score to a z-score?
- How does the z-table help in calculating probabilities for a normal distribution?
- What is the procedure for finding the probability that a score is greater than a specific value?
- Explain the steps involved in calculating the probability of a score falling between two given values using a z-table.
- Why is the total area under a normal distribution curve considered equal to 1?