7:56
NEW TradingView Indicator That Shows You Exactly Where To BUY & SELL
STOCK MARKET US
Overview
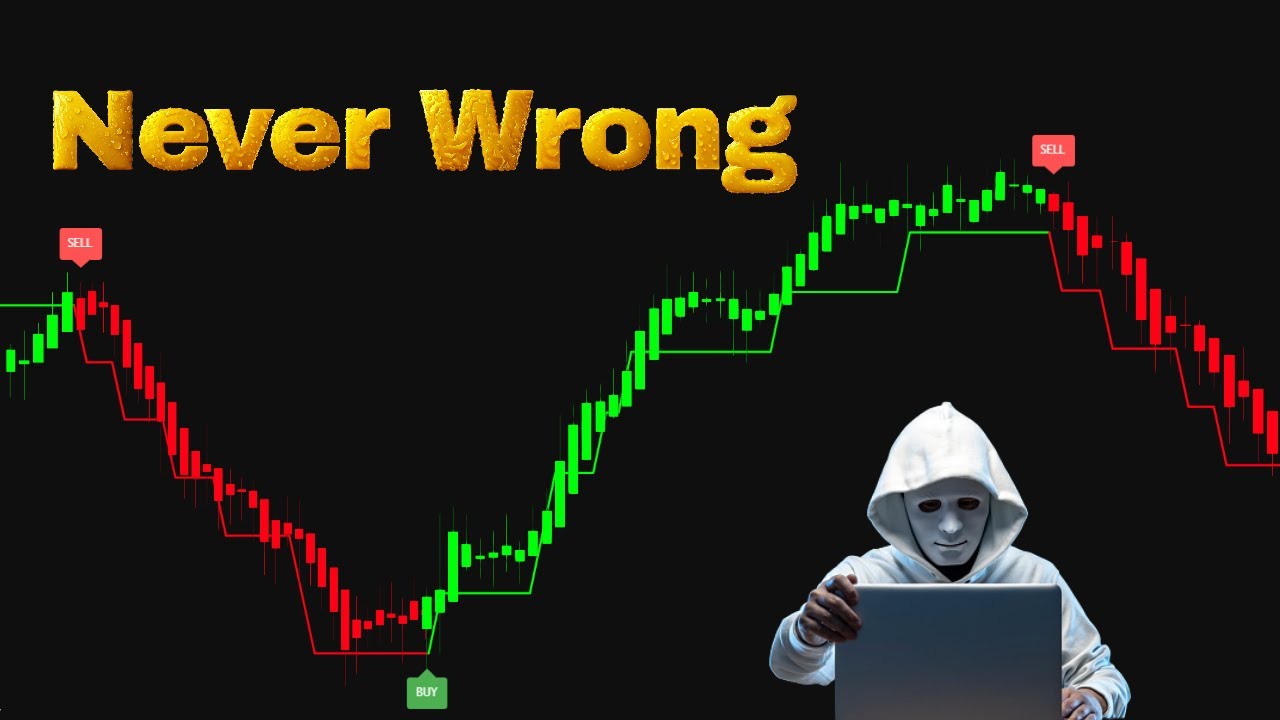
This video introduces a trading strategy using two custom TradingView indicators, 'Q-Trend' and 'Clinger Volume Oscillator,' to identify precise buy and sell signals. It details how to set up these indicators by adjusting specific parameters and explains the conditions for entering long and short trades. The strategy emphasizes confirmation through candlestick patterns and utilizes a fixed stop-loss and a 1:1.5 risk-to-reward ratio, illustrated with multiple trade examples to demonstrate its effectiveness in achieving profit targets.
How was this?
Save this permanently with flashcards, quizzes, and AI chat
Chapters
- A new TradingView indicator is presented to simplify buy/sell decisions.
- The tool is designed for traders of all experience levels.
- It uses advanced algorithms to analyze trends and price movements for optimal entry/exit points.
- The indicator offers a user-friendly interface for real-time market visualization.
Understanding the core purpose of this strategy helps learners appreciate its potential to improve trading efficiency and confidence by providing clear, actionable signals.
The video introduces a tool that simplifies trading decisions and enhances market analysis for traders of all levels.
- The 'Q-Trend' indicator provides buy and sell arrows on the chart.
- It is recommended to use the strategy on a 1-minute timeframe for gold trading.
- Key settings to adjust include 'Color 0', 'Color 1', 'ATR Period' (from 14 to 32), and 'Emma Smoother Period' (from 3 to 10).
Properly configuring the Q-Trend indicator is crucial because these specific parameter changes are designed to optimize its sensitivity and accuracy for generating trading signals.
In TradingView, search for 'Q-Trend', then change 'ATR Period' to 32 and 'Emma Smoother Period' to 10.
- The 'Clinger Volume Oscillator' is represented by red and green columns on the chart.
- Specific settings require adjusting 'Fast Length' (from 34 to 38) and 'Slow Length' (from 55 to 60).
- Users need to modify 'Color 0', 'Color 1', 'Color 2', and 'Color 3' settings.
- Options like 'Show Histogram' should be enabled, while 'Hide Background' and other 'Hide' options should be activated.
Adjusting the Clinger Volume Oscillator's parameters, such as its length settings and visual elements, is essential for it to effectively complement the Q-Trend indicator and provide reliable volume-based confirmation.
Search for 'Clinger Volume Oscillator' in TradingView, change 'Fast Length' to 38 and 'Slow Length' to 60, and ensure the histogram is shown while hiding the background.
- A buy signal is triggered when the Q-Trend indicator shows a buy signal (typically an upward arrow).
- Confirmation requires the Clinger Volume Oscillator to display green columns.
- The market must also form a bullish (green) candlestick.
- The stop loss is set at the previous market low, with a risk-to-reward ratio of 1:1.5.
Following these precise entry conditions ensures that trades are taken only when multiple indicators and market conditions align, increasing the probability of a successful trade.
If Q-Trend shows a buy signal, Clinger Volume Oscillator is green, and a bullish candle forms, place a buy order with the stop loss below the recent low.
- A sell signal occurs when the Q-Trend indicator indicates a sell (typically a downward arrow).
- Confirmation requires the Clinger Volume Oscillator to show red columns.
- The market must form a bearish (red) candlestick.
- The stop loss is placed at the previous market high, maintaining a 1:1.5 risk-to-reward ratio.
Adhering to these specific sell signal criteria helps traders identify potential downward price movements with a defined risk management strategy.
When Q-Trend signals a sell, Clinger Volume Oscillator is red, and a bearish candle appears, enter a sell order with the stop loss above the recent high.
- Multiple examples demonstrate successful buy and sell trades based on the strategy's conditions.
- Each example shows the Q-Trend signal, Clinger Volume Oscillator color, and candlestick confirmation.
- Trades consistently hit the 1:1.5 profit target.
- The strategy is shown to be effective across several instances, reinforcing the setup's validity.
Reviewing concrete trade examples helps solidify understanding by showing the strategy in action and demonstrating how the defined rules lead to profitable outcomes.
A specific trade is shown where a buy signal appears, the oscillator is green, a bullish candle forms, and the trade successfully reaches its 1:1.5 target.
Key takeaways
- Combining trend indicators (Q-Trend) with volume oscillators (Clinger Volume Oscillator) can provide more reliable trading signals.
- Customizing indicator parameters is essential for tailoring them to specific trading strategies and timeframes.
- Confirmation from candlestick patterns alongside indicator signals improves trade entry accuracy.
- Strict adherence to stop-loss placement and risk-to-reward ratios is critical for managing trading risk.
- The 1-minute timeframe on gold can be suitable for this strategy due to potentially faster signal generation.
- Visualizing market conditions in real-time with user-friendly indicators can lead to more confident trading decisions.
- This strategy aims to identify optimal entry and exit points by analyzing market trends and price movements.
Key terms
TradingViewIndicatorQ-TrendClinger Volume OscillatorBuy SignalSell SignalStop LossRisk-to-Reward RatioBullish CandleBearish CandleATR PeriodEmma Smoother PeriodFast LengthSlow Length
Test your understanding
- What are the two primary indicators used in this trading strategy and what role does each play?
- How should the 'ATR Period' and 'Emma Smoother Period' settings be adjusted for the Q-Trend indicator?
- What three conditions must be met to confirm a valid buy trade according to this strategy?
- Why is it important to set a stop loss and a specific risk-to-reward ratio for each trade?
- What visual cues from the Clinger Volume Oscillator indicate a potential buy or sell opportunity?