55:01
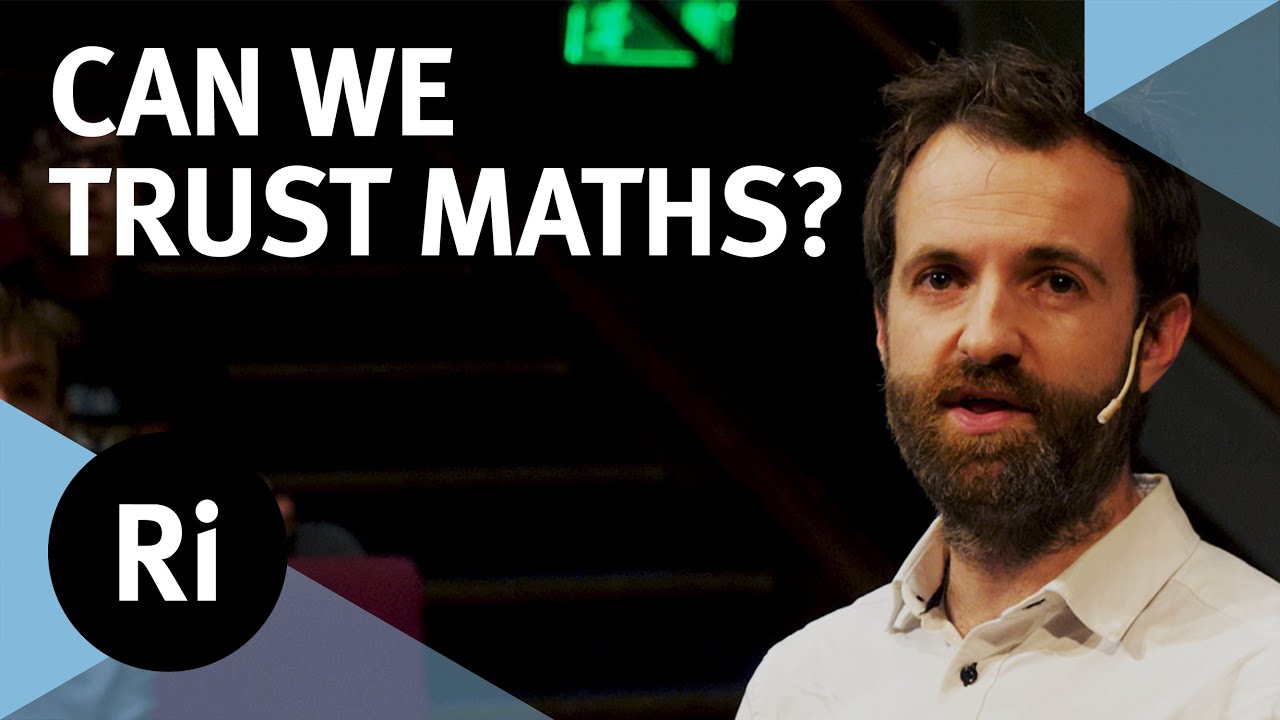
Can We Trust Maths? - with Kit Yates
The Royal Institution
Overview
This video explores the trustworthiness of mathematics, particularly how statistics are presented and interpreted in real-world scenarios. It delves into the surprising results of medical screening tests, the manipulative use of statistics in media headlines, and the misrepresentation of crime data. The speaker uses relatable examples and thought experiments, like the birthday problem, to illustrate complex concepts and encourage critical thinking about numbers presented by experts, media, and politicians. The core message is to question statistics, understand their context, and avoid being misled by the 'illusion of certainty' that numbers can create.
How was this?
Save this permanently with flashcards, quizzes, and AI chat
Chapters
- The book 'The Maths of Life and Death' uses stories to explain how mathematics impacts real people's lives, often without them realizing it.
- It covers mathematics in medicine, media, and the criminal justice system, including terrorism.
- The focus is on making complex mathematical ideas accessible to a general audience, with no equations required.
This chapter sets the stage by emphasizing that mathematics is not just an abstract academic subject but a practical tool that influences our daily decisions and understanding of the world.
Examples include miscarriages of justice due to statistical misinterpretation by expert witnesses or incorrect medical test results due to a lack of statistical understanding.
- Medical screening tests, like mammograms, can produce surprising results due to low disease prevalence and false positive rates.
- A low prevalence of breast cancer (0.4%) means that even with a 90% accurate test, most positive results are false positives.
- False positives can cause significant psychological distress and lead to unnecessary treatments with their own risks.
- The probability of receiving at least one false positive increases with the number of screenings, becoming likely after about seven tests.
Understanding the statistics behind medical screenings is crucial for making informed decisions about personal health and avoiding undue anxiety or unnecessary medical interventions.
A hypothetical scenario with 10,000 women over 50 shows that out of those receiving a positive mammogram, only 3.5% actually have breast cancer, illustrating the impact of low prevalence and false positives.
- Newspapers often use 'relative risk' figures, which sound alarming (e.g., a 20% increase), to sensationalize health-related statistics.
- These figures can be misleading because they don't present the 'absolute risk,' which is the actual, often much smaller, increase in likelihood.
- Mismatched framing, where benefits are presented with large percentages and risks with small decimals, is common in media and medical literature.
- It's important to look for absolute risk figures and question statistics presented without context.
Recognizing how statistics are framed in the media empowers individuals to critically evaluate health claims and avoid making decisions based on exaggerated or misleading information.
A newspaper headline claiming a bacon sandwich increases colorectal cancer risk by 20% is contrasted with the actual absolute risk increase of only 1% when considering the base rates.
- Statistics can be deliberately fabricated or misrepresented, especially in political contexts, to support a particular agenda.
- Comparing raw numbers of incidents without considering population size (per capita rates) can lead to false conclusions.
- The 'greatest danger' to a population group is not necessarily determined by the absolute number of incidents but by the rate relative to the group's size.
- Politicians and public figures may use manipulated statistics to influence public opinion or spread misinformation.
This section highlights the dangers of trusting statistics presented by authority figures without verification, as they can be used to manipulate perceptions and advance biased narratives.
An infographic retweeted by Donald Trump presented fabricated crime statistics, which were then used in a misleading article about the 'greatest danger' to Black people, obscuring the actual per capita rates.
- The 'birthday problem' demonstrates that in a group of just 23 people, there's a greater than 50% chance that at least two share a birthday.
- This counterintuitive result arises because the number of possible pairs of people grows much faster than the number of people.
- The formula for calculating the number of pairs (triangular numbers) helps explain why coincidences are more likely than intuitively expected.
- This principle can be applied to understand the likelihood of seemingly significant coincidences, such as terrorist attacks occurring on the same date.
Understanding the birthday problem helps us appreciate how likely coincidences are, preventing us from attributing random events to deliberate planning or hidden patterns.
The 2014 World Cup, where 16 out of 32 teams had at least two players sharing a birthday, serves as a real-world illustration of the birthday problem's predictions.
- Coincidences are surprisingly common and often go unnoticed until they are pointed out.
- The 'illusion of certainty' created by statistics can be misleading; numbers are not always irrefutable truths.
- It's essential to question statistics, understand their context, and fact-check information, even without a math degree.
- Be wary of mathematicians offering bets, as they often understand the probabilities involved.
The overarching message encourages active critical thinking and skepticism towards numerical claims, empowering individuals to navigate a world saturated with data and statistics.
The speaker's bet with an audience member about shared birthdays illustrates how understanding probability can lead to an advantage.
Key takeaways
- Low prevalence diseases mean that positive screening results are often false positives.
- Media headlines frequently use relative risk to exaggerate dangers, while absolute risk provides a more accurate picture.
- Statistics can be deliberately manipulated by media, politicians, and even in scientific literature through mismatched framing.
- The birthday problem shows that coincidences are mathematically more likely than our intuition suggests.
- Always question the source and context of statistics presented to you.
- Don't accept numbers as absolute truths; probe for underlying data and methodologies.
- Critical thinking about statistics is a vital skill for everyone, not just mathematicians.
Key terms
PrevalenceFalse PositiveFalse NegativeRelative RiskAbsolute RiskMismatched FramingBirthday ProblemPer Capita RateIllusion of Certainty
Test your understanding
- How does the low prevalence of a disease impact the interpretation of a positive screening test result?
- What is the difference between relative risk and absolute risk, and why is this distinction important when reading media reports?
- Explain the concept of 'mismatched framing' and provide an example of how it can be used to mislead.
- How does the birthday problem illustrate that coincidences can be more probable than we intuitively believe?
- What steps can an individual take to avoid being misled by statistics presented in the media, medical reports, or by public figures?