1:25:59
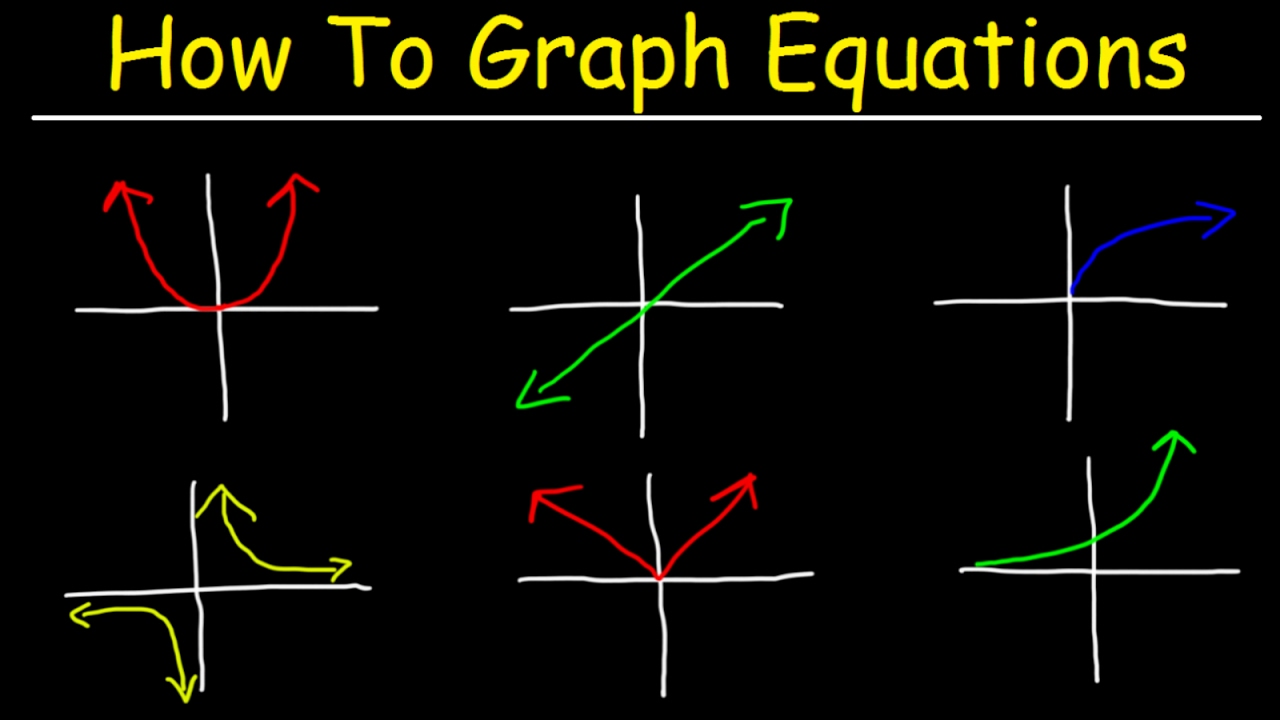
How To Graph Equations - Linear, Quadratic, Cubic, Radical, & Rational Functions
The Organic Chemistry Tutor
Overview
This video provides a comprehensive guide to graphing various types of functions, starting with linear equations and progressing to quadratic, absolute value, cubic, radical, rational, exponential, and logarithmic functions. It explains different methods for graphing, including using tables, slope-intercept form, standard form, and vertex form. The video also covers graphing inequalities, transformations, and identifying key features like intercepts, vertices, axes of symmetry, and asymptotes. The goal is to equip learners with the skills to visualize and understand these mathematical relationships.
How was this?
Save this permanently with flashcards, quizzes, and AI chat
Chapters
- Linear equations can be graphed using a table of values by plotting points derived from inputting x-values into the equation.
- The slope-intercept form (y = mx + b) allows graphing by first plotting the y-intercept (b) and then using the slope (m) to find subsequent points (rise over run).
- Standard form (Ax + By = C) is graphed by finding the x-intercept (set y=0) and y-intercept (set x=0) and connecting these two points.
- Horizontal lines are represented by y = constant, and vertical lines by x = constant.
- Graphing linear inequalities involves plotting the boundary line (dashed for > or <, solid for >= or <=) and shading the appropriate region based on the inequality symbol and a test point.
Understanding linear equations is fundamental as they represent constant rates of change and form the basis for more complex functions.
Graphing y = -2x + 1 by plotting the y-intercept at (0,1) and using the slope of -2 (down 2, right 1) to find additional points.
- Quadratic equations (y = ax^2 + bx + c) form parabolic shapes.
- The vertex of a parabola can be found using the formula x = -b / 2a, which also defines the axis of symmetry.
- A table of values centered around the vertex helps in plotting the parabola, utilizing symmetry where points equidistant from the axis of symmetry have the same y-value.
- Vertex form (y = a(x-h)^2 + k) directly reveals the vertex (h, k) and the direction of opening (up if 'a' is positive, down if 'a' is negative).
- Completing the square is a method to convert standard form to vertex form.
Quadratic equations model projectile motion and optimization problems, making their graphical representation crucial for understanding these real-world scenarios.
Finding the vertex of y = x^2 + 2x + 3 using x = -2 / (2*1) = -1, then plotting points around x=-1 to sketch the parabola.
- Absolute value functions (|x|) create a V-shape, with transformations (shifts, stretches, reflections) altering its position and orientation.
- The vertex of an absolute value function is determined by the values inside and outside the absolute value bars.
- Cubic functions (x^3) have an 'S' shape and can be shifted, stretched, or reflected.
- The parent cubic function passes through the origin, while transformations shift this central point.
- Negative signs in front of the absolute value or cubic term cause reflections (downward V or inverted S-shape).
These functions model non-linear relationships that are not symmetrical like quadratics, appearing in areas like signal processing and population dynamics.
Graphing y = |x - 3| + 4 by identifying the vertex at (3, 4) and plotting points with a slope of 1 (up/down 1 for every 1 right/left).
- Radical functions (like square roots) typically start at a specific point and extend in one direction, with reflections altering the direction.
- The domain and range of radical functions are restricted by the values under the radical.
- Exponential functions (like 2^x) have a characteristic curve that either increases or decreases rapidly.
- Exponential graphs have a horizontal asymptote, a line the graph approaches but never touches.
- Transformations (shifts, stretches, reflections) apply to both radical and exponential functions.
Radical functions are used in geometry and physics, while exponential functions model growth and decay processes like compound interest or radioactive decay.
Graphing y = sqrt(x + 3) - 2 by starting at the point (-3, -2) and extending the curve upwards and to the right, noting the domain starts at x = -3 and the range starts at y = -2.
- Logarithmic functions are the inverse of exponential functions and have a vertical asymptote.
- Key points for graphing logarithms are found by setting the argument of the log equal to 1, the base, and values that simplify nicely.
- Rational functions (ratios of polynomials) often have vertical and horizontal asymptotes, which guide the shape of the graph.
- Vertical asymptotes occur where the denominator is zero (and not cancelled by the numerator), while horizontal asymptotes depend on the degrees of the numerator and denominator.
- Slant (oblique) asymptotes occur when the numerator's degree is exactly one higher than the denominator's, requiring polynomial long division to find.
These functions are essential for modeling phenomena with limits, thresholds, or complex relationships, such as population limits or signal attenuation.
Graphing y = 1/(x - 2) + 3 by identifying the vertical asymptote at x=2 and the horizontal asymptote at y=3, then plotting points like (3,4) and (1,2).
Key takeaways
- Understanding parent functions (linear, quadratic, absolute value, cubic, radical, exponential, logarithmic) is key to graphing transformations.
- Key features like intercepts, vertices, asymptotes, and axes of symmetry are crucial for accurately sketching graphs.
- Transformations (shifts, stretches, compressions, reflections) can be applied to parent functions to graph more complex equations.
- Inequalities require shading a region, determined by the boundary line type (solid/dashed) and the direction of the inequality.
- Factoring and simplifying rational expressions can reveal holes and vertical asymptotes.
- The relationship between the degrees of the numerator and denominator determines the presence and type of horizontal or slant asymptotes in rational functions.
- Exponential functions have horizontal asymptotes, while logarithmic functions have vertical asymptotes.
- Choosing strategic points (like intercepts, vertices, or values that simplify expressions) makes graphing significantly easier than plotting random points.
Key terms
Slope-Intercept FormStandard FormVertexAxis of SymmetryCompleting the SquareParent FunctionAsymptote (Vertical, Horizontal, Slant)DomainRangeTransformation (Shift, Stretch, Reflection)
Test your understanding
- How does the slope-intercept form (y = mx + b) simplify the process of graphing linear equations compared to using a table of values?
- What is the significance of the vertex and axis of symmetry when graphing a quadratic equation, and how are they determined?
- Explain the difference in graphing absolute value functions and cubic functions, particularly regarding their 'parent' shapes and transformations.
- How do you determine the domain and range for radical and exponential functions, and what role do asymptotes play in their graphs?
- What steps are involved in identifying and graphing vertical, horizontal, and slant asymptotes for rational functions?