Box and whisker plot | Descriptive statistics | Probability and Statistics | Khan Academy
Khan Academy
Overview
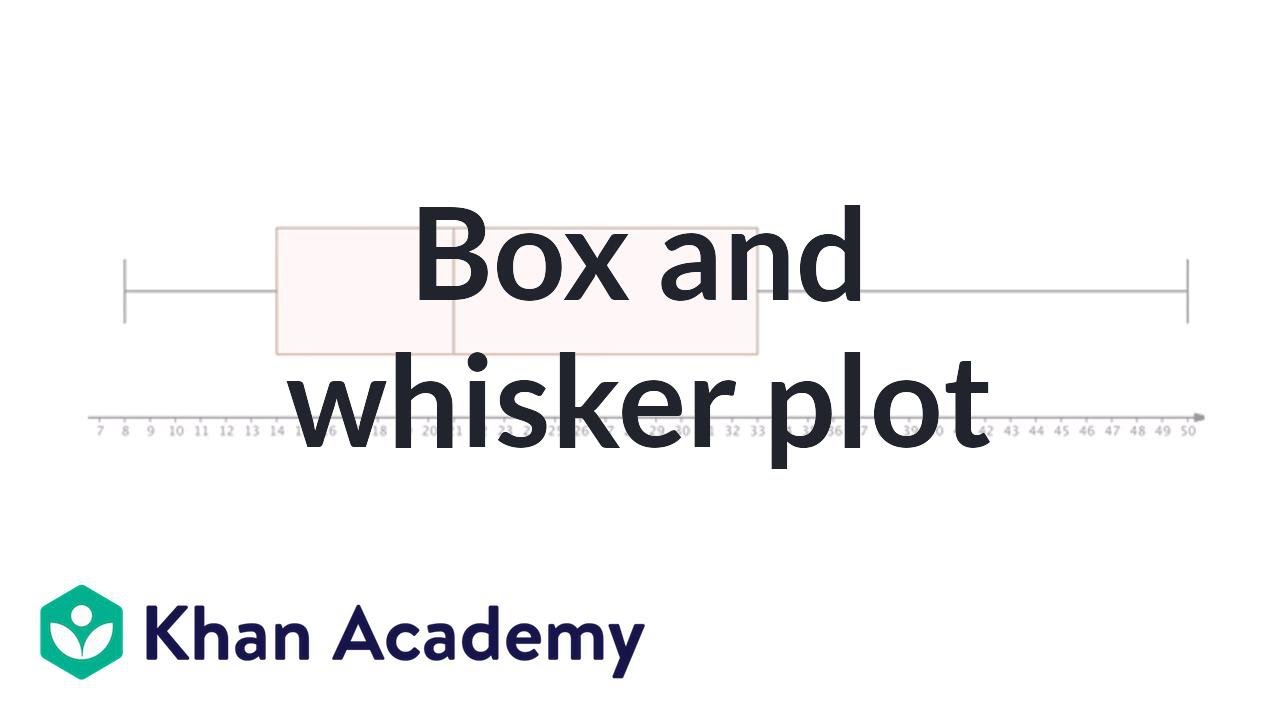
This video explains how to interpret a box-and-whisker plot using an example of tree ages in a forest. The plot visually represents the distribution of data, showing the minimum, maximum, median, and quartiles. The presenter demonstrates how to calculate the range (maximum minus minimum) and identify the median age. The video breaks down the plot into its components: whiskers representing the overall spread (minimum to maximum) and the box representing the interquartile range (IQR). The lines within the box and at its edges signify the first quartile (Q1), median (Q2), and third quartile (Q3), dividing the data into four equal parts. This allows for a quick understanding of data spread and central tendency.
Save this permanently with flashcards, quizzes, and AI chat
Chapters
- Box-and-whisker plots visualize data spread and central tendency.
- Used to display the age of approximately 100 trees in a forest.
- Key components include whiskers and a box.
- Whiskers indicate the minimum and maximum data points.
- The left whisker shows the lowest tree age (8 years).
- The right whisker shows the oldest tree age (50 years).
- The range is the difference between the maximum and minimum values.
- Range is defined as the highest data point minus the lowest data point.
- For the tree ages, the range is 50 - 8 = 42 years.
- This shows the total spread of ages in the surveyed forest.
- The box represents the middle 50% of the data.
- The line inside the box is the median (Q2).
- The median age of the trees is 21 years.
- The median divides the data into two halves: below and above 21 years.
- The box's left edge is the first quartile (Q1).
- The box's right edge is the third quartile (Q3).
- These quartiles divide the data into four equal parts (quartiles).
- Q1 is the median of the lower half of the data (ages below the overall median).
- Q3 is the median of the upper half of the data (ages above the overall median).
- The range of tree ages is 42 years (from 8 to 50).
- The median age is 21 years.
- The median (21) is closer to the lower end of the data spread.
- This indicates that while some trees are old, the central tendency is towards younger trees.
Key takeaways
- A box-and-whisker plot visually summarizes data distribution.
- Whiskers show the minimum and maximum values, defining the range.
- The range is calculated as Maximum - Minimum.
- The median (middle line in the box) represents the 50th percentile of the data.
- The box itself represents the Interquartile Range (IQR), containing the middle 50% of the data.
- The edges of the box (Q1 and Q3) divide the data into four quartiles.
- Box plots help quickly assess data spread, central tendency, and identify potential outliers (though not explicitly discussed here).
- The position of the median within the box and relative to the whiskers gives clues about data skewness.