CSCI 5612 Project Presentation
Max White
Overview
This project analyzes National Basketball Association (NBA) team performance using advanced statistics and machine learning. The goal is to classify teams into low, mid, and high performing tiers based on their win percentages and advanced metrics like offensive rating, defensive rating, and true shooting percentage. The analysis employs both unsupervised techniques (PCA, clustering) to identify natural groupings and understand feature importance, and supervised methods (Naive Bayes, Decision Trees, SVM, Logistic Regression) to build predictive models. Key findings suggest that net rating and offensive efficiency are primary drivers of team performance tiers, and that models accounting for feature correlations, like logistic regression and SVM, outperform those that assume independence.
Save this permanently with flashcards, quizzes, and AI chat
Chapters
- The project aims to classify NBA teams into performance tiers (low, mid, high) using advanced statistics.
- It also seeks to identify which advanced statistics are most influential in determining team performance.
- The data is sourced from the NBA Stats API and includes metrics like offensive rating, defensive rating, net rating, and true shooting percentage.
- The target variable is team performance, categorized into low, medium, and high tiers based on win percentage.
- Principal Component Analysis (PCA) was used to reduce the dimensionality of 10+ advanced stats into a more visualizable 2-3 dimensions.
- PCA revealed that a combination of net rating, offensive rating, and player impact estimate effectively represented team quality.
- Clustering algorithms (K-Means, Hierarchical, DBSCAN) were applied to group teams based on their statistical profiles.
- Clustering results aligned well with the predefined low, medium, and high performance tiers, relabeling them as 'rebuilding', 'competitive middle', and 'elite' clusters.
- Associative Rule Mining was explored to find relationships between different statistical metrics within these clusters, such as the link between low turnover rate and offensive rating.
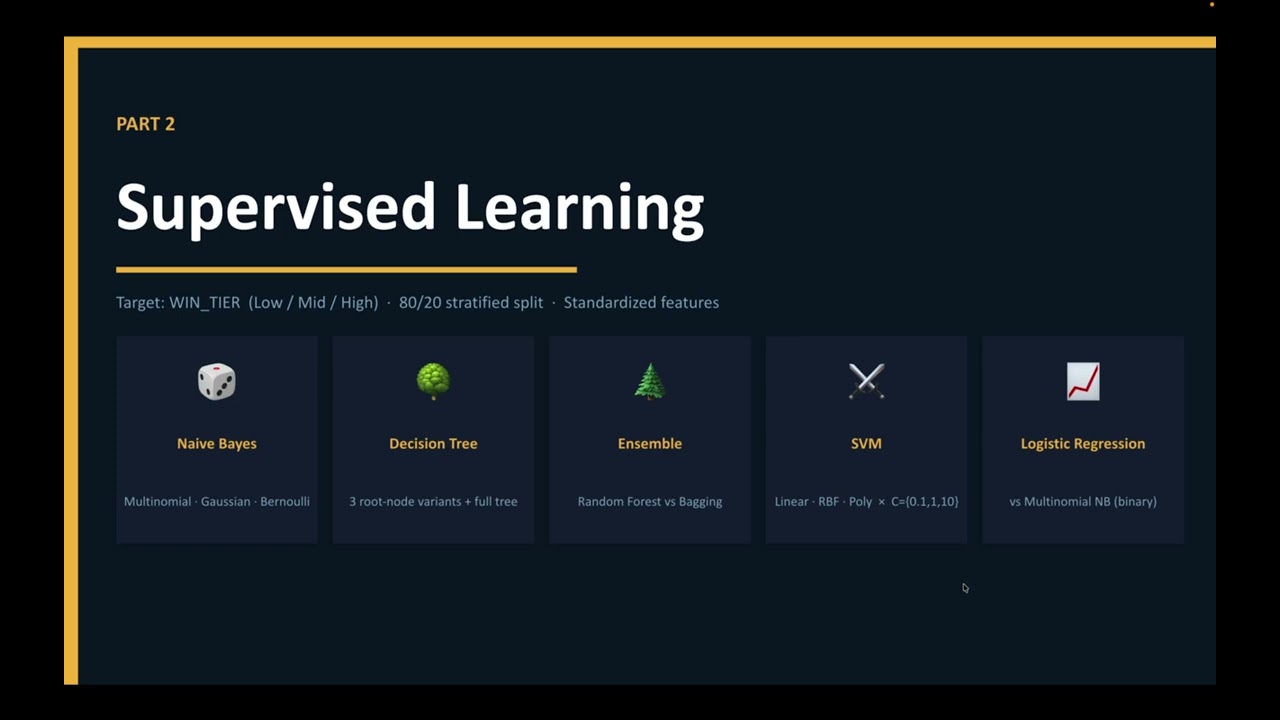
- Data was split into 80% training and 20% testing sets using a stratified approach to prevent season-specific trends from skewing results.
- Naive Bayes models (multinomial, Gaussian, Bernoulli) were tested, with Gaussian performing best on continuous data but struggling with the mid-tier classification.
- Decision Trees, when unlimited in depth, split primarily on net rating but showed signs of overfitting and poor performance on unseen seasons.
- Support Vector Machines (SVM) with a Radial Basis Function (RBF) kernel and a C value of 10 performed most consistently, effectively separating data that didn't divide linearly.
- Logistic Regression outperformed Naive Bayes by not assuming feature independence and by learning feature weights and relationships, which is crucial given the correlation between NBA stats.
- NBA teams naturally fall into three performance tiers, primarily driven by net rating and offensive efficiency.
- PCA confirms that team statistics can be meaningfully reduced to one or two key dimensions.
- Ensemble methods like Random Forests and SVMs with RBF kernels are top performers for classification.
- Models that account for feature correlations (e.g., Logistic Regression, SVM) are more effective than those assuming independence (e.g., Naive Bayes).
- Future work could involve incorporating more seasons, acknowledging potential shifts in game dynamics over time, and including individual player statistics.
Key takeaways
- Team performance in the NBA can be effectively classified into distinct tiers using advanced statistical metrics.
- Net rating and offensive efficiency are the most critical factors differentiating high-performing NBA teams.
- PCA is a valuable tool for reducing complex, correlated sports statistics into a few interpretable dimensions.
- Clustering analysis can validate predefined performance tiers and reveal natural groupings within team data.
- Machine learning models that account for feature correlations (like Logistic Regression and SVM) are superior for NBA performance prediction compared to those assuming independence.
- The choice of machine learning algorithm significantly impacts the accuracy and robustness of team performance classification.
- While advanced stats are powerful, their inherent correlations require careful consideration in model selection and interpretation.
Key terms
Test your understanding
- How does PCA help in understanding the relationships between various advanced NBA statistics?
- What are the primary statistical drivers that distinguish elite NBA teams from average or rebuilding teams?
- Why do machine learning models that account for feature correlations tend to outperform those that assume feature independence in the context of NBA data?
- Compare and contrast the performance of Naive Bayes and Logistic Regression for classifying NBA team performance, and explain the reasons for the difference.
- How can unsupervised learning techniques like clustering be used to validate or refine performance tiers for NBA teams?