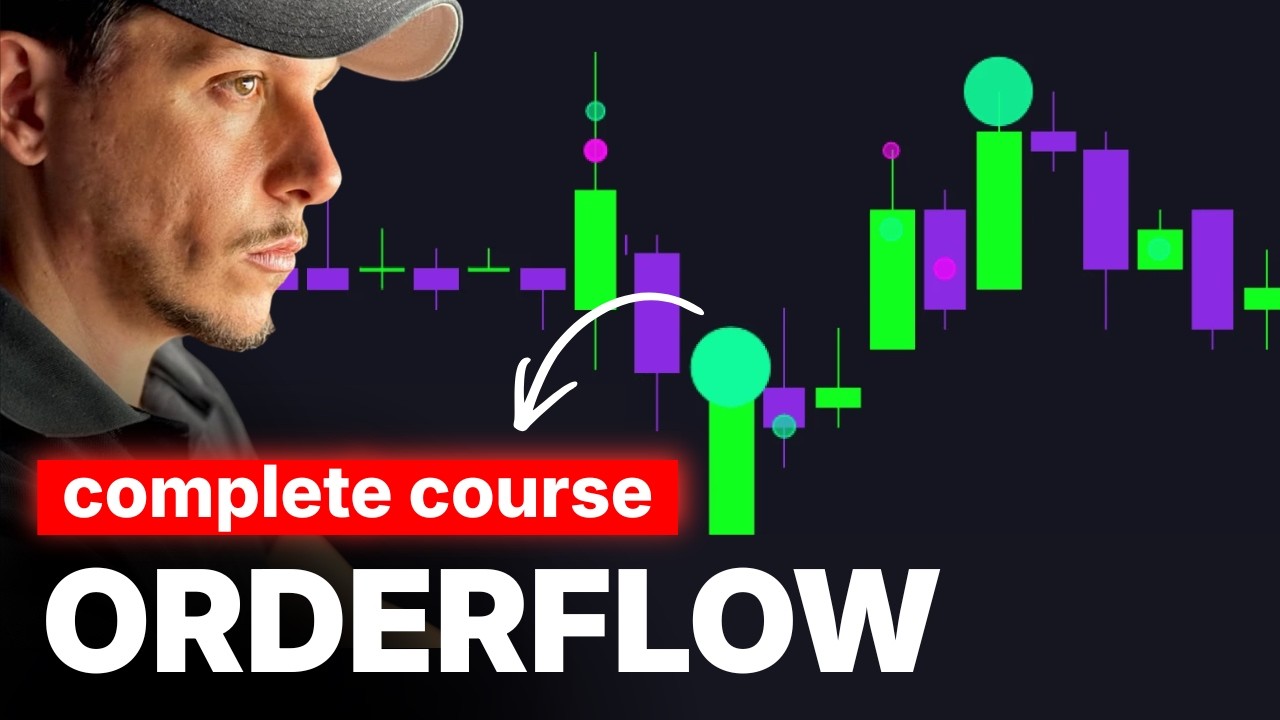
The Only Orderflow Guide You'll Ever Need
Fabervaale ENG
Overview
This video provides a comprehensive guide to order flow trading, explaining its core concepts and practical applications for identifying market movements and smart money footprints. It details the interaction between aggressive and passive market participants, the role of order books and footprints, and how price moves based on order execution. The guide introduces key concepts like delta, volume profile, value areas, and low volume nodes, illustrating how institutions build and distribute value. Finally, it demonstrates how to combine these tools with order flow patterns for precise trade execution, focusing on absorption, exhaustion, and initiative auctions to confirm market bias and capitalize on trends.
Save this permanently with flashcards, quizzes, and AI chat
Chapters
- The market is driven by the interaction between buyers and sellers, represented by volume.
- Participants are categorized as aggressive (market orders) or passive (limit orders).
- Market orders execute immediately at the best available price, while limit orders wait for a specific price.
- The order book shows passive liquidity at different price levels, and market orders interact with this liquidity.
- The footprint chart visualizes executed orders, showing aggressive buyers on the right and aggressive sellers on the left.
- When aggressive orders exceed available passive liquidity at a price level, the market moves to the next available price, causing slippage.
- Passive orders (limit orders) have price certainty but execution uncertainty, while market orders have execution certainty but price uncertainty.
- The interaction between aggressive and passive forces dictates price direction and magnitude.
- Aggressive participants create pressure and move the market, while passive participants provide resistance.
- Absorption occurs when high buying or selling pressure is met with significant opposing passive liquidity, resulting in little price movement.
- Delta, the difference between aggressive buy and sell orders, indicates the net buying or selling pressure within a specific price range.
- Understanding the relationship between effort (volume/delta) and reward (price movement) helps identify market strength or weakness.
- Volume profile visualizes the distribution of trading volume across price levels over a specific period.
- The Value Area represents the price range where the majority (typically 70%) of volume was traded, indicating price acceptance.
- The Point of Control (POC) is the price level with the highest volume within the Value Area.
- Imbalance occurs when price moves significantly outside the Value Area, suggesting a potential trend initiation or continuation.
- Low Volume Nodes (LVNs) are price levels with minimal trading activity, indicating inefficient price delivery.
- Markets often revisit LVNs to rebalance or retest these inefficient areas before continuing a trend.
- LVNs can act as support or resistance levels, especially after a breakout from a balanced area.
- Identifying LVNs is crucial for anticipating potential price reactions and finding entry points in trending markets.
- Institutions build value by accepting prices within a range and distribute value by selling into strength.
- A shift in the Value Area (e.g., from an uptrend profile to a downtrend profile) signals a potential change in market direction.
- Failed auctions, or 'hooks,' occur when price attempts to break out of a range but quickly reverses, trapping traders.
- Premium and discount zones, derived from volume profile, help identify overbought or oversold conditions for potential trades.
- Specialized tools like 'Deep Charts' allow filtering order flow data to focus on large participants (smart money).
- Combining volume profile analysis with real-time order flow execution patterns provides high-probability trade setups.
- Confirmation comes from observing how aggressive orders interact with identified levels and whether they are absorbed or result in price movement.
- The goal is to merge volume analysis, order flow execution, and price results to confirm bias and manage risk.
Key takeaways
- Order flow provides a deeper understanding of market dynamics by showing the actual execution of trades between buyers and sellers.
- The footprint chart visualizes the battle between aggressive and passive participants, revealing price drivers.
- Delta quantifies the net aggression between buyers and sellers, offering insights into market pressure.
- Volume profile helps identify areas of market acceptance (Value Area) and inefficiency (Low Volume Nodes), guiding bias.
- Absorption patterns, where effort doesn't yield proportional results, are key signals for potential reversals.
- Institutions often create failed auctions or 'traps' to manipulate price before moving in their intended direction.
- Combining volume profile analysis with real-time order flow execution provides robust confirmation for trading decisions.
Key terms
Test your understanding
- How does order flow analysis differ from traditional price action trading?
- What information does a footprint chart provide that a standard candlestick chart does not?
- Explain the concept of delta and how it can be used to interpret market sentiment.
- What is a Low Volume Node, and why is it significant in market analysis?
- How can recognizing absorption patterns help a trader make more informed decisions?