16:06
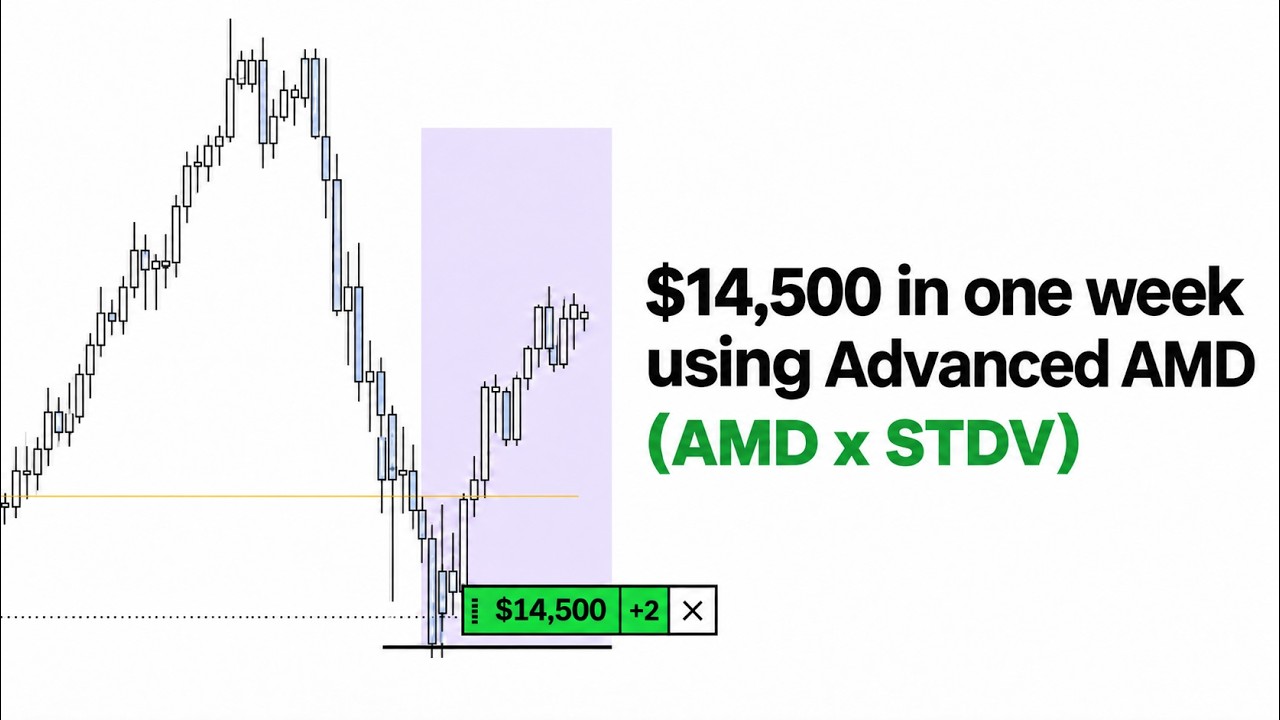
How I made $14,500 in 5 days using Advanced AMD (AMD x STDV)
NQSimon
Overview
This video explains a day trading strategy focused on the AMD (Accumulation, Manipulation, Distribution) model, combined with order blocks, breaks of structure, and standard deviation. The presenter demonstrates how to identify trading opportunities and execute trades, showcasing personal profits of $14,500 in five days. The core of the strategy involves understanding market cycles, confirming entries with structural breaks, and using standard deviation to predict price targets, with a strong emphasis on practical examples and a step-by-step breakdown of profitable trades.
How was this?
Save this permanently with flashcards, quizzes, and AI chat
Chapters
- The presenter shares proof of making $14,500 in five days through day trading.
- Key performance metrics include a high risk-to-reward ratio (102.2) and win rate (87%).
- Weekly outlook and specific trade executions are presented as evidence.
- A significant payout of approximately $10.5k is shown, with $4k pending.
This section establishes credibility and demonstrates the potential profitability of the trading strategy being presented.
Showing a weekly stats summary with a 102.2 risk-to-reward ratio and $14,500 in funded profits.
- AMD (Accumulation, Manipulation, Distribution) is a three-phase market cycle.
- Order blocks are specific price zones used to identify entry points.
- Breaks of structure (BOS) are used to confirm the end of manipulation and the start of distribution.
- Standard deviation helps predict potential price targets or reversal zones.
Understanding these foundational concepts is crucial for applying the entire trading strategy, as they form the building blocks for identifying and executing trades.
Defining AMD as a three-phase process: accumulation (building positions), manipulation (inducing traders in the wrong direction), and distribution (exiting positions).
- High time frame AMD cycles are analyzed to determine the overall market direction or 'bias'.
- Identifying accumulation lows and manipulation highs/lows helps establish the current market phase.
- A break of structure confirms the end of manipulation and signals the start of distribution.
- The 'draw on liquidity' is typically the previous accumulation low.
Establishing a high-time frame bias helps traders align their lower-time frame entries with the prevailing market trend, increasing the probability of successful trades.
Analyzing a weekly chart to identify an accumulation phase, followed by upward manipulation that took out previous highs, and then a break of structure confirming distribution towards the accumulation low.
- Lower time frame analysis uses AMD, order blocks, and breaks of structure for precise entries.
- Order block chains, where one order block forms after another, can offer refined entry opportunities.
- Manipulation legs are identified, and entries are sought within specific standard deviation zones (-2 is highlighted).
- Breaks of structure on lower time frames confirm entries after price re-enters a key order block.
This chapter details the practical application of the core concepts for entering trades, focusing on how to find high-probability setups on lower time frames.
A trade setup where price accumulates, manipulates up, breaks structure, forms an order block, retests that order block, and then distributes down to a target standard deviation zone.
- A specific trade is analyzed with a 1:6.7 risk-reward ratio, netting $8,400.
- The trade involved identifying a manipulation leg and targeting the -2 standard deviation zone and midnight open.
- An order block formed after manipulation, followed by a break of structure, confirmed the entry.
- An 'inducement' (internal liquidity sweep) before entry provided additional confirmation.
This concrete example illustrates the application of AMD, order blocks, and standard deviation in a real trading scenario, showing how to achieve significant profits from a single trade.
A trade where price accumulated, manipulated up to take out highs (inducement), formed an order block, and then was entered on a retest, targeting the -2 standard deviation zone for an $8,400 profit.
- A trade during the Asia session is detailed, achieving a 1:24 risk-reward ratio.
- The strategy involved identifying accumulation during Asia, looking for manipulation into specific order blocks.
- A break of structure on the 5-minute chart confirmed manipulation had ended.
- Entries were triggered by a 3-minute order block retest, targeting a standard deviation zone.
This example showcases how the strategy can be applied during specific trading sessions like Asia, demonstrating flexibility and the potential for very high risk-reward ratios.
Accumulation in Asia, followed by manipulation lower into a 15-minute order block, a 5-minute break of structure, and then a long entry triggered by a 3-minute order block, targeting a -2 standard deviation zone.
- A simpler trade example with a 1:8.6 risk-reward ratio is presented.
- It demonstrates a basic AMD cycle: accumulation, manipulation down, distribution up, and reaccumulation.
- An order block formed after manipulation was used for entry, targeting accumulation highs.
- An alternative entry was shown after a break of structure and retest of a newly formed order block.
This example simplifies the strategy, showing that even a basic understanding of AMD and order blocks can lead to profitable trades with good risk-reward ratios.
Identifying an AMD cycle where price accumulated, manipulated down to take out lows, then distributed up, forming a 5-minute order block that was used for a long entry targeting previous highs.
- The presenter reiterates that the explained AMD model with order blocks and breaks of structure is a fundamental and effective trading strategy.
- He emphasizes that this strategy is the basis for his $14,500 weekly profits.
- An invitation is extended to join his free Discord community for daily outlooks, live trading, and direct access.
- The Discord offers application-based entry for those interested in learning directly from the presenter.
This section summarizes the value proposition of the strategy and encourages learners to engage further with the presenter's community for continued learning and support.
Invitation to join a free Discord server where the presenter shares proof, outlooks, and conducts live trading sessions.
Key takeaways
- The AMD (Accumulation, Manipulation, Distribution) cycle provides a framework for understanding market phases and predicting price direction.
- Order blocks are critical price zones that often act as turning points, especially after manipulation or breaks of structure.
- Breaks of structure serve as confirmation signals that manipulation has ended and a new trend phase has begun.
- Standard deviation zones can be used to identify potential profit targets or areas where price is likely to reverse.
- Combining high time frame bias with lower time frame execution using AMD, order blocks, and BOS significantly increases trade probability.
- Identifying 'draws on liquidity,' such as previous highs or lows, is essential for setting trade targets.
- Even simple applications of AMD and order blocks can yield high risk-reward ratios, making the strategy accessible for learning.
Key terms
AMD (Accumulation, Manipulation, Distribution)Order BlockBreak of Structure (BOS)Standard DeviationRisk-to-Reward RatioDraw on LiquidityManipulation LegInducementFair Value Gap (FVG)SMT (Smart Money Technique)
Test your understanding
- How does the concept of 'manipulation' in AMD trading differ from a standard trend continuation?
- What role does a 'break of structure' play in confirming an AMD cycle and validating an order block entry?
- Explain how standard deviation zones are used to set profit targets or identify potential reversal points within the AMD model.
- Why is it important to establish a high time frame bias before looking for lower time frame entries using AMD?
- Describe a scenario where an 'inducement' might be used as an additional confirmation for an entry based on an order block.