11:53
Chi-squared Test
Bozeman Science
Overview
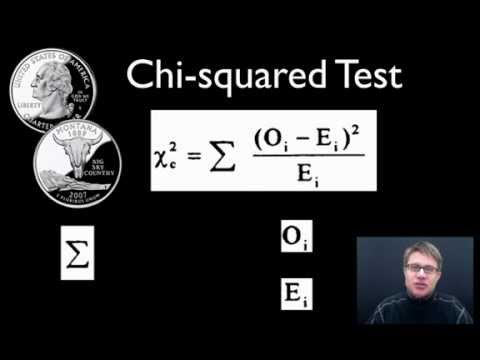
This video explains the Chi-squared test, a statistical tool used to determine if observed data deviates significantly from expected data, or if the variation is likely due to chance. It covers the formula, the concepts of observed (O) and expected (E) values, the null hypothesis, degrees of freedom, and critical values. The video demonstrates how to calculate the Chi-squared statistic and interpret the results by comparing it to a critical value to either accept or reject the null hypothesis, using examples of coin flips and dice rolls.
How was this?
Save this permanently with flashcards, quizzes, and AI chat
Chapters
- The Chi-squared test helps determine if observed data variation is due to chance or a tested variable.
- The formula involves summing the squared difference between observed (O) and expected (E) values, divided by the expected values.
- The null hypothesis states there is no statistically significant difference between observed and expected frequencies.
- The test allows us to accept or reject this null hypothesis based on the data.
Understanding the Chi-squared test is crucial for scientists to objectively analyze experimental results and differentiate between random fluctuations and meaningful outcomes.
Flipping a coin 100 times and getting 62 heads and 38 tails. The expected values would be 50 heads and 50 tails. The Chi-squared test helps decide if this 62/38 split is just chance or indicates a biased coin.
- Observed (O) values are the actual data collected from an experiment.
- Expected (E) values are the frequencies predicted by the null hypothesis, often calculated before the experiment.
- Degrees of freedom (df) are calculated as the number of categories (outcomes) minus 1.
- A critical value, typically set at a 0.05 significance level, is used as a threshold for decision-making.
These components are the building blocks of the Chi-squared calculation and interpretation, providing the framework for statistical analysis.
For coin flips (heads/tails), there are 2 categories. Degrees of freedom = 2 - 1 = 1. The critical value for 1 df at a 0.05 significance level is 3.841.
- In an experiment, 50 coins were flipped, resulting in 28 heads (observed) and 22 tails (observed).
- The expected values for 50 flips are 25 heads and 25 tails.
- The Chi-squared calculation is (28-25)^2/25 + (22-25)^2/25 = 9/25 + 9/25 = 18/25 = 0.72.
- Since 0.72 is less than the critical value of 3.841 (for 1 df), the null hypothesis is accepted.
This example demonstrates the practical application of the Chi-squared formula and the process of comparing the calculated value to the critical value to draw a conclusion.
Observed: 28 heads, 22 tails. Expected: 25 heads, 25 tails. Calculated Chi-squared = 0.72. Critical value = 3.841. Since 0.72 < 3.841, accept the null hypothesis.
- Thirty-six dice were rolled, with observed counts for each face (1-6).
- The expected count for each face is 6 (36 total dice / 6 faces).
- The Chi-squared calculation resulted in a value of 9.6.
- With 6 outcomes (faces), the degrees of freedom is 6 - 1 = 5.
- The critical value for 5 df at 0.05 significance is 11.070.
This more complex example shows how to handle multiple categories and reinforces the decision-making process when the observed data appears skewed.
Observed counts for dice rolls varied, with 10 sixes. Expected count for each face was 6. Calculated Chi-squared = 9.6. Critical value for 5 df = 11.070. Since 9.6 < 11.070, accept the null hypothesis.
- If the calculated Chi-squared value exceeds the critical value, reject the null hypothesis.
- Rejecting the null hypothesis suggests there is a statistically significant difference, and the variation is likely due to factors other than chance.
- If the calculated Chi-squared value is less than or equal to the critical value, accept the null hypothesis.
- Accepting the null hypothesis means the observed differences can reasonably be attributed to random chance.
Correct interpretation of the Chi-squared test results is essential for making valid scientific conclusions about experimental data.
In the dice example, although there were many sixes (observed), the calculated Chi-squared of 9.6 was still less than the critical value of 11.070, leading to the acceptance of the null hypothesis.
Key takeaways
- The Chi-squared test is a statistical method to compare observed data with expected data to determine if differences are due to chance.
- The null hypothesis assumes no significant difference between observed and expected values.
- Observed values are actual experimental results, while expected values are theoretical predictions.
- Degrees of freedom are calculated as the number of possible outcomes minus one.
- A critical value (often at p=0.05) serves as a threshold; if the calculated Chi-squared statistic exceeds it, the null hypothesis is rejected.
- If the calculated Chi-squared statistic is below the critical value, the null hypothesis is accepted, meaning observed differences are likely due to chance.
- The Chi-squared test is applicable to various scientific fields, including biology and statistics, for analyzing categorical data.
Key terms
Chi-squared testObserved values (O)Expected values (E)Null hypothesisDegrees of freedom (df)Critical valueStatistical significanceP-value (implied by 0.05 critical value)
Test your understanding
- What is the primary purpose of the Chi-squared test in scientific research?
- How are observed and expected values determined in a Chi-squared analysis?
- What is the relationship between the null hypothesis and the critical value in a Chi-squared test?
- How do you calculate the degrees of freedom for a Chi-squared test?
- Under what conditions would you reject the null hypothesis after performing a Chi-squared test?