5:55
Introduction to increasing, decreasing, positive or negative intervals | Algebra I | Khan Academy
Khan Academy
Overview
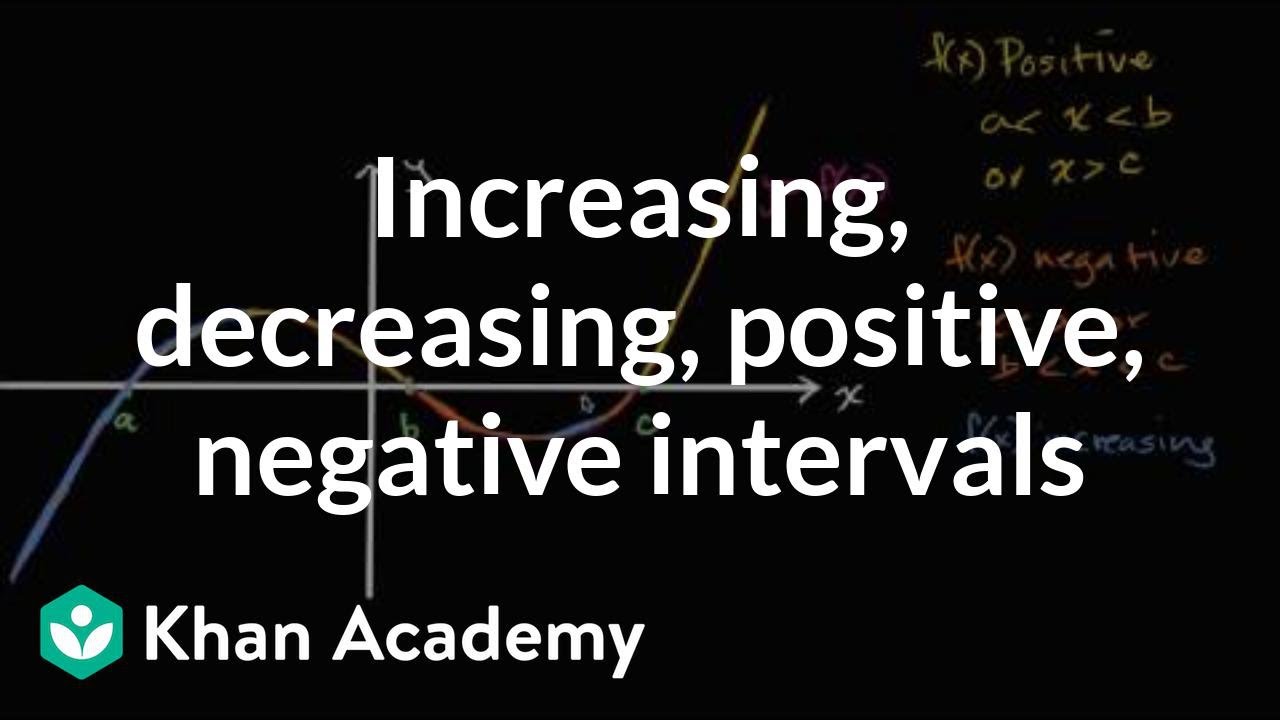
This video explains how to identify intervals on a graph where a function is positive or negative, and where it is increasing or decreasing. It defines positive as the function's output (y-value) being above the x-axis, and negative as being below the x-axis. It defines increasing as the y-value rising as the x-value rises, and decreasing as the y-value falling as the x-value rises. The video emphasizes that these two concepts (positive/negative and increasing/decreasing) are distinct and should be analyzed separately, as their corresponding intervals on the x-axis do not necessarily overlap.
How was this?
Save this permanently with flashcards, quizzes, and AI chat
Chapters
- A function is positive when its graph is above the x-axis, meaning f(x) > 0.
- A function is negative when its graph is below the x-axis, meaning f(x) < 0.
- The points where the function intersects the x-axis (where f(x) = 0) are the boundaries between positive and negative intervals.
- Intervals are expressed using inequalities based on the x-values.
Understanding where a function is positive or negative helps in analyzing its behavior and solving equations or inequalities related to the function's output.
If a function is above the x-axis between x=a and x=b, it is positive on the interval (a, b). If it is below the x-axis between x=b and x=c, it is negative on the interval (b, c).
- A function is increasing when its y-values increase as its x-values increase.
- A function is decreasing when its y-values decrease as its x-values increase.
- Visually, increasing intervals correspond to the graph going upwards from left to right, and decreasing intervals correspond to the graph going downwards from left to right.
- The points where the function transitions from increasing to decreasing or vice versa (local extrema) are the boundaries between these intervals.
- At these boundary points, the function is neither strictly increasing nor strictly decreasing.
Identifying increasing and decreasing intervals reveals the function's trend and shape, which is crucial for optimization problems and understanding the rate of change.
If a function's graph goes up as you move from left to right until x=d, and then goes down until x=e, it is increasing for x < d and decreasing for x between d and e.
- The intervals where a function is positive or negative are determined by its position relative to the x-axis.
- The intervals where a function is increasing or decreasing are determined by its direction of change as x increases.
- These two sets of intervals are independent and do not necessarily overlap.
- It is important to analyze these characteristics separately to fully understand the function's behavior.
Confusing these concepts can lead to incorrect analysis of a function's properties. Recognizing their distinct nature ensures accurate interpretation of graphical information.
A function can be increasing while its values are negative (e.g., moving from -5 to -2 on the x-axis), or decreasing while its values are positive (e.g., moving from 5 to 2 on the x-axis).
Key takeaways
- Positive intervals occur where the function's graph lies above the x-axis.
- Negative intervals occur where the function's graph lies below the x-axis.
- Increasing intervals are where the function's y-values rise as x-values rise.
- Decreasing intervals are where the function's y-values fall as x-values rise.
- The x-intercepts mark the boundaries for positive/negative intervals.
- Local maximums and minimums mark the boundaries for increasing/decreasing intervals.
- The concepts of positive/negative and increasing/decreasing describe different aspects of a function's behavior and should be analyzed independently.
Key terms
Positive intervalNegative intervalIncreasing intervalDecreasing intervalFunction's value (f(x))x-axisy-axisInterval notationRate of changeTangent line slope
Test your understanding
- How do you determine if a function is positive based on its graph?
- What does it mean for a function to be decreasing, and how is this represented on a graph?
- Why is it important to distinguish between positive/negative intervals and increasing/decreasing intervals?
- What mathematical notation is used to describe the intervals where a function is positive or negative?
- How can the slope of a tangent line indicate whether a function is increasing or decreasing at a specific point?