This ONE Candle Will CHANGE Your Trading | Candle Range Theory (CRT)
Nitro Trades
Overview
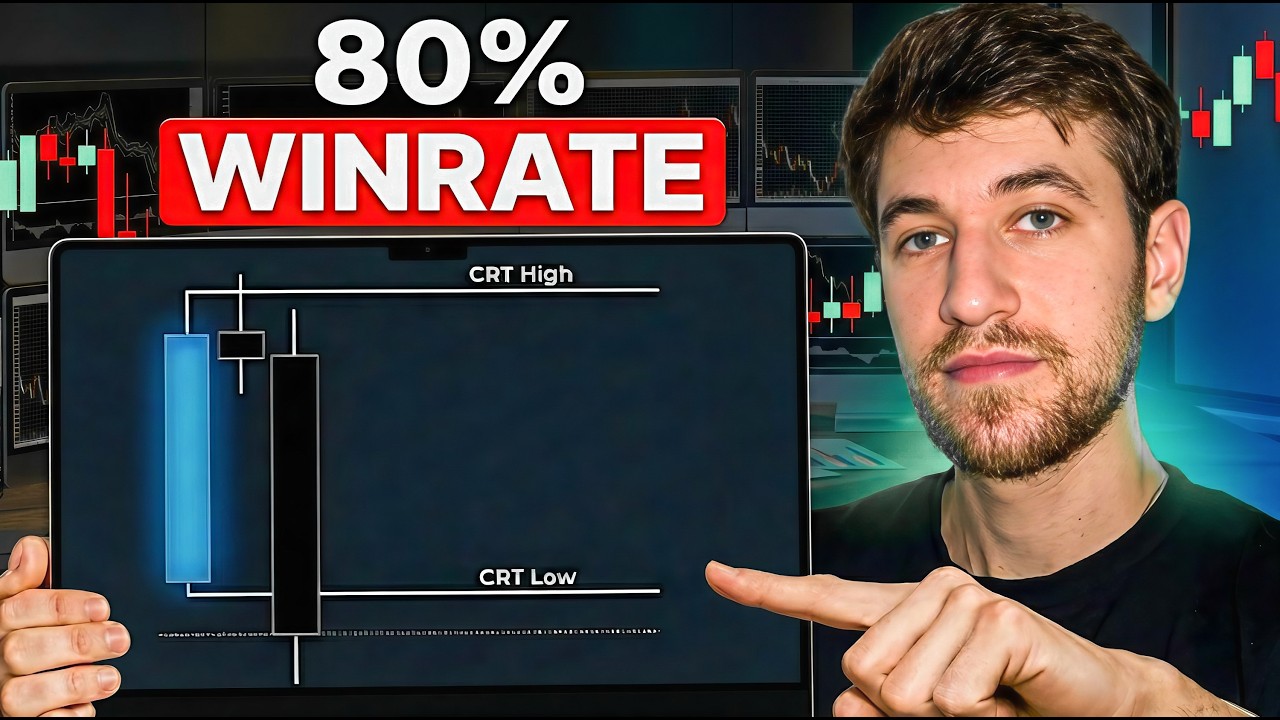
This video introduces the Candle Range Theory (CRT), a trading strategy focused on identifying and executing a single, high-probability trade setup each day. The core concept involves marking the high and low of a previous candle, waiting for a price break and reversal back inside that range, and then entering a trade on the third candle's follow-through to the opposite end of the initial range. The strategy emphasizes trading with the prevailing market trend and provides specific entry, stop-loss, and take-profit rules, aiming for a 1.5 to 2 risk-to-reward ratio. The presenter stresses the importance of discipline, taking only the 'perfect' setup, and backtesting the strategy.
Save this permanently with flashcards, quizzes, and AI chat
Chapters
- CRT is a simple, high-probability trading setup designed to be taken once per day.
- The strategy aims to identify the 'one perfect trade' to avoid overtrading and improve consistency.
- Many traders incorrectly apply CRT by taking too many setups or misinterpreting the rules.
- Use 1-hour, 30-minute, or 15-minute timeframes; 1-hour offers higher quality, 15-minute offers more frequency.
- Step 1: Mark the high and low (including wicks) of the most recent candle.
- Step 2: Wait for price to break this high or low, then reverse and close back inside the marked range.
- Step 3: The third candle should show a U-shaped reversal, moving towards the opposite end of the initial candle's range.
- Identify the 'middle candle' (the one that broke and reversed).
- Enter a trade when price breaks the high (for a long) or low (for a short) of this middle candle on a lower timeframe (1-2 minute).
- Set the take profit at the opposite end of the initial CRT candle's range.
- Adjust the stop-loss to achieve a 1.5 to 2 risk-to-reward ratio.
- The market moves to fill or 'pick up' orders resting at extreme price levels (liquidity).
- When price breaks a high, it's collecting sell orders; it then needs to deliver these to buyers at the opposite extreme (the low).
- Conversely, breaking a low collects buy orders, which must then be delivered to sellers at the high.
- CRT exploits this natural market tendency for price to move from one order pool to another.
- Always align CRT trades with the overall market trend (identified on higher timeframes like 1-hour).
- If the market is in a strong uptrend, only look for long CRT setups; ignore short setups.
- The New York session (starting 9:30 AM ET) is highlighted as the optimal time for CRT setups.
- If no setup occurs by early afternoon (e.g., 12-1 PM ET), stop trading for the day.
- A trend shift is indicated when the market starts making lower highs and lower lows after a period of higher highs and higher lows (or vice versa).
- When a trend shifts, adjust your bias and only look for CRT setups that align with the new direction.
- Even if a bullish CRT forms during a confirmed downtrend, it should be ignored if it goes against the primary trend.
Key takeaways
- The most effective trading strategies focus on identifying a single, high-probability setup per day.
- Candle Range Theory (CRT) relies on a specific three-candle sequence involving a break, reversal, and follow-through within a defined range.
- Always trade CRT in alignment with the prevailing market trend to maximize success probability.
- The market moves to fill order imbalances; CRT capitalizes on this by anticipating price movement between liquidity pools.
- Discipline is paramount: only take the 'perfect' CRT setup and stop trading if it doesn't appear within the optimal session.
- Understanding trend shifts is crucial for adapting your trading bias and avoiding trades against the dominant market direction.
- Thorough backtesting and personal verification are essential to build confidence in any trading strategy.
Key terms
Test your understanding
- How do you define the initial range for a Candle Range Theory (CRT) setup?
- What specific price action must occur after a candle breaks the previous range's high or low for a CRT setup to be valid?
- Why is it important to align CRT trades with the overall market trend?
- How does the concept of 'order flow' or 'liquidity' explain the effectiveness of CRT?
- What criteria indicate a trend shift, and how should a trader adjust their CRT approach accordingly?