7:53
The Rounded Bottom Is the Most Powerful Bullish Pattern in Technical Analysis. Tim Knight Proves It
tastylive
Overview
This video explains the rounded bottom, a powerful bullish chart pattern in technical analysis. Unlike its inverse, the rounded top, the rounded bottom can precede massive price increases, potentially thousands of percent. The pattern forms a gradual, curved base over an extended period, indicating a shift from selling pressure to buying accumulation. Several historical examples, including ABC, Amgen, Coca-Cola, Microsoft, Micron, Gilead, Eli Lilly, and Applied Materials, illustrate how this pattern, especially when prolonged, can lead to significant and sustained upward price movements, though breakdowns below the base can signal a reversal.
How was this?
Save this permanently with flashcards, quizzes, and AI chat
Chapters
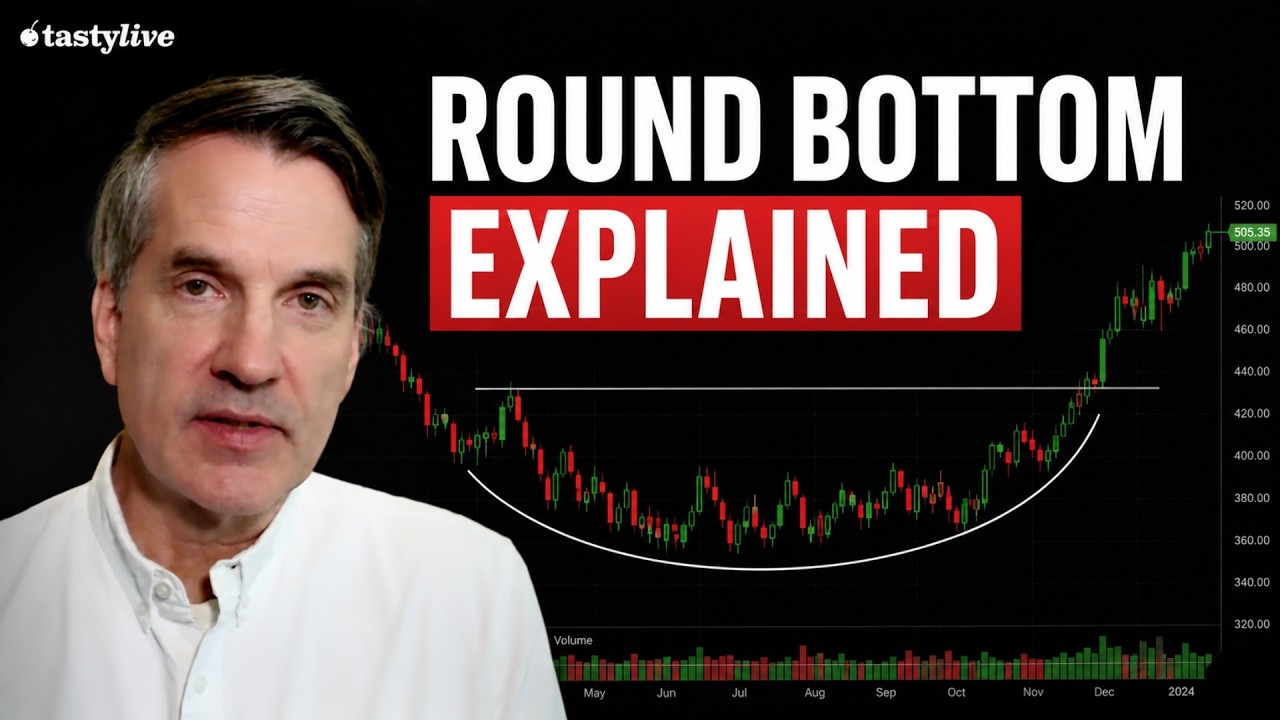
- The rounded bottom is a bullish chart pattern characterized by a gently curved, saucer-like shape.
- It is the inverse of the rounded top pattern, which signals a bearish trend.
- A key difference from the rounded top is the potential for enormous price increases (hundreds or thousands of percent) following a rounded bottom breakout, due to the nature of long positions versus short positions.
- The pattern forms a base from which a significant upward price movement is expected.
Understanding the rounded bottom helps identify potential long-term investment opportunities with substantial growth potential.
The general shape of a rounded bottom is described as a gently curved arch beneath the price action, serving as a base for a future upward push.
- The ABC company's stock shows a rounded bottom that formed over many years, followed by a significant and steady price increase after breaking out.
- Amgen (AMGN) provides another example where a rounded bottom base preceded a long, steady, multi-hundred percent rise.
- The term 'bottom' can be misleading; it's often a continuation pattern, not just the absolute lowest point after a decline.
- It can represent a 'pause that refreshes' within an uptrend or the end of a bear market, where weaker holders sell and new buyers accumulate.
Examining real-world examples helps solidify the visual recognition and understanding of the pattern's formation and subsequent price action.
The chart of Amgen (AMGN) is used to highlight a rounded bottom base, which, after some fine-tuning for an idealized view, preceded a tremendous multi-hundred percent rise.
- Coca-Cola (KO) exhibits multiple rounded bottoms, with a larger, cleaner example showing a struggle to break out after being trapped in the base for years.
- Microsoft's stock history includes a significant rounded bottom during a period of stagnation, which preceded a new bull market after its breakout.
- The duration of the rounded bottom pattern is crucial; longer bases (forming over years) tend to lead to more potent breakouts.
- Eli Lilly (LLY) demonstrates this with a massive rounded bottom that lasted for years, preceding a 20x rise from around $40 to quadruple digits.
The longevity of the pattern directly correlates with the potential magnitude of the subsequent price move, emphasizing patience and the significance of extended consolidation.
Eli Lilly (LLY) experienced a 20x rise after breaking out from a rounded bottom that lasted for many years, transforming its price from around $40 to the quadruple digits.
- Some stocks exhibit a 'personality' by repeatedly forming specific patterns, like rounded bottoms.
- Observing past instances of a pattern in a particular stock can provide clues about its future behavior after similar formations.
- Micron (MU) and Gilead (GILD) show multiple rounded bottoms, each typically preceding a significant upward price movement.
- This repetition suggests that a stock's historical price action with certain patterns can be a reliable indicator for future performance.
Recognizing a stock's historical tendency to form rounded bottoms allows for more informed predictions about its potential future price trajectory.
Micron (MU) has historically shown that whenever it forms a rounded bottom, it typically precedes a very powerful push higher.
- While rounded bottoms are bullish, breakdowns below the pattern's base can signal a severe price drop.
- Manhattan Associates showed a large rounded base followed by a rise, but subsequent smaller patterns failed, leading to a breakdown below the original base and a severe stock drop.
- After a breakout, price retracements are normal, but they should hold above the prior resistance (now support) level of the base.
- Diminishing pattern efficacy can occur with smaller, successive patterns, suggesting a loss of bullish momentum.
Understanding the potential for breakdowns is crucial for risk management, as it highlights the importance of confirming the breakout and being aware of reversal signals.
In the case of Manhattan Associates, after a breakout from a large rounded base, subsequent smaller patterns failed, leading to a breakdown below the base and a severe stock drop.
- Applied Materials (AMAT) offers an idealized example of a rounded bottom, representing a significant phase in its price history.
- This pattern, formed during a long stall period, preceded a strong upward move, contributing to the stock's potential for generational wealth creation.
- After breaking out, the stock experienced higher lows and higher highs, confirming a sustained bull market.
- The video emphasizes that while patterns can be idealized, their underlying principles of accumulation and breakout remain consistent.
This chapter reinforces the concept of the rounded bottom as a foundational pattern for significant, long-term wealth accumulation when properly identified and confirmed.
Applied Materials (AMAT) formed a rounded base during a multi-year stall, which, upon breaking out, initiated a new phase of higher lows and higher highs, indicative of long-term growth.
Key takeaways
- The rounded bottom is a powerful bullish pattern that can signal the start of a substantial, long-term price increase.
- The duration of the rounded bottom formation is directly correlated with the potential magnitude of the subsequent breakout.
- A stock's historical tendency to form rounded bottoms can be a reliable indicator of its future performance.
- While generally bullish, a breakdown below the rounded bottom base signals a significant bearish reversal and potential for sharp declines.
- Confirmation of a breakout above the base's resistance level is crucial before considering a long position.
- The rounded bottom represents a period of accumulation where buying interest overcomes selling pressure, leading to a shift in trend.
- Understanding the 'personality' of a stock can enhance the predictive power of chart patterns like the rounded bottom.
Key terms
Rounded BottomBullish PatternChart PatternTechnical AnalysisBreakoutBaseSupportResistanceContinuation PatternBear MarketAccumulation
Test your understanding
- What are the primary visual characteristics of a rounded bottom pattern?
- How does the potential price movement following a rounded bottom differ from that of a rounded top?
- Why is the duration of a rounded bottom pattern considered important for its predictive power?
- What does it signify when a stock breaks down below the base of a previously formed rounded bottom?
- How can observing a stock's historical pattern behavior improve trading decisions related to rounded bottoms?